

 Revising base years, improving methodologies and opting for better databases are part of normal practice in national income accounting.
In January 2015, India’s Central Statistics Office (CSO) introduced a new series of National Account Statistics. The new series made several changes. In particular, it revised the base year from 2004-05 to 2011-12. It also employed a new methodology to estimate India’s gross domestic product (GDP) and used new data sets to arrive at the GDP. However, even though the CSO’s changes were in line with international norms of national income accounting, some academics and researchers raised doubts about the new GDP estimates.
Revising base years, improving methodologies and opting for better databases are part of normal practice in national income accounting. But the debate intensified when, in 2018, the statistical establishment released two back-series (that is, recalibrating the GDP data for past years based on the new methodology) that contradicted each other.
![]()
The first back-series, presented by the National Statistical Commission (NSC) in July 2018, found that the average economic growth between 2005-06 and 2011-12 was 8.6% instead of the 8.3% according to the old series. The second back-series, calculated by CSO and published in November 2018, found this average to be just 7%.
The statistical debate quickly acquired a political colour because of the years concerned. Former Finance Minister P Chidambaram called the CSO back-series a “hatchet job”. The then Finance Minister Arun Jaitley backed the new way of GDP estimation as more reflective of the ground realities.
Earlier this year, the accusation that the new method overestimates GDP received a boost after Arvind Subramanian, India’s Chief Economic Adviser between 2014 and 2018, argued that the new series overestimated GDP growth by as much as 2.5 percentage points. In other words, if last year’s GDP growth was 7% then, according to Subramanian, the actual GDP growth would be only about 4.5%.
Those who say nay
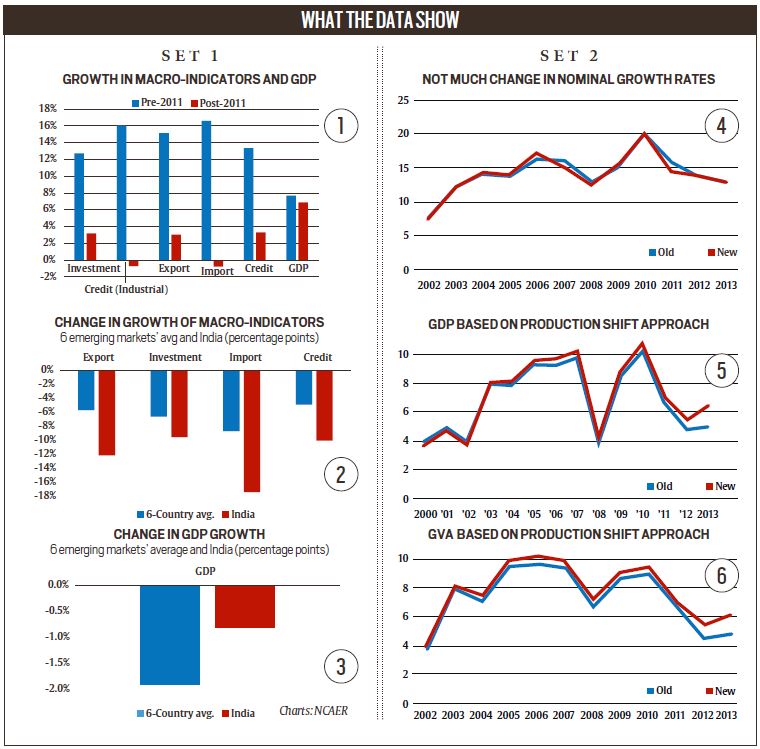
In his paper, presented in June, Subramanian presented a history of how he looked at the new series since its introduction and always found its results “puzzling”. For instance, as chart 1 (top left) shows, India’s GDP growth rate between 2011 and 2016 appears out of sync with the fate of key macroeconomic indicators, such as investment, exports and credit etc.; this is starkly in contrast to how things were for a decade before the new series with 2011-12 as the base year. Also, as charts 2 and 3 show, this disconnect between key macroeconomic indicators post-2011 becomes even clearer when India’s data are compared to the average of six emerging economies. India’s GDP declined far less than the 6-country average despite its macro-indicators being worse hit.
Subramanian argued higher GDP growth between 2011 and 2016 is neither backed by movement in key macro-indicators, nor by a surge in productivity (otherwise corporate profits would not have declined in this period), nor by a surge in consumption (otherwise consumer confidence and industrial capacity utilisation would not have dipped sharply).
Lastly, Subramanian argued that the GDP Deflator (level of inflation), used to subtract from nominal GDP growth in order to arrive at the “real” GDP growth rate, was considerably less than the retail inflation (as measured by Consumer Price Index) in the 2011-16 period. This essentially resulted in an overestimation of “real” GDP growth rate.
Those who say aye
N R Bhanumurthy, Professor at NIPFP and the chair of the NSC sub-committee that presented the first back-series, is among those who have countered some of Subramanian’s fundamental assertions. For one, he has shown that the nominal GDP growth rate, which is the only observable variable, has not changed under the old and new series (chart 4, top right). Secondly, there was no consolidated CPI before 2011. As such, arguing that the gap between CPI and GDP deflator was low between 2002 and 2011, and wide between 2011 and 2016, is unfounded.
Most Read 1Chandrayaan-3 mission: Dawn breaks on Moon, all eyes on lander, rover to wake up 2As Indo-Canadian relations sour, anxiety grips Indian students, residents who wish to settle in Canada 3Karan Johar says Sanjay Leela Bhansali did not call him after Rocky Aur Rani: ‘He’s never called me but…’ 4Gadar 2 box office collection day 40: Hit by Shah Rukh Khan’s Jawan onslaught, Sunny Deol movie ends BO run with Rs 45 lakh earning 5Shubh’s tour in India cancelled: Why is the Canada-based singer facing the music?
According to Bhanumurthy, if one applies the Production Shift approach — wherein new activities (that are added in the new series) are given progressively more weight (or less weight) as one move ahead in time (or moves back in time) — the two series do not show any discordant breaks either for GDP or for gross value added (charts 5 and 6).
In fact, given the wide differences between the two data methodologies and data sets, Bhanumurthy characterises the whole debate as an “apples to oranges” comparison. “You can predict the direction of GDP growth using leading indicators such as car sales, but you cannot ‘estimate’ GDP growth rate for a year gone by on the basis of such indicators,” he says.
Also ReadShubh’s tour in India cancelled: Why is the Canada-based singer facing th…What is WhatsApp Channels, the latest feature launched by MetaSensex, Nifty dip by 1%: What has triggered this sell-off?‘Socialist’ and ‘secular’: What do these words mean in the Constitution, …
Bhanumurthy explains: Why lower fiscal deficit isn’t always good news